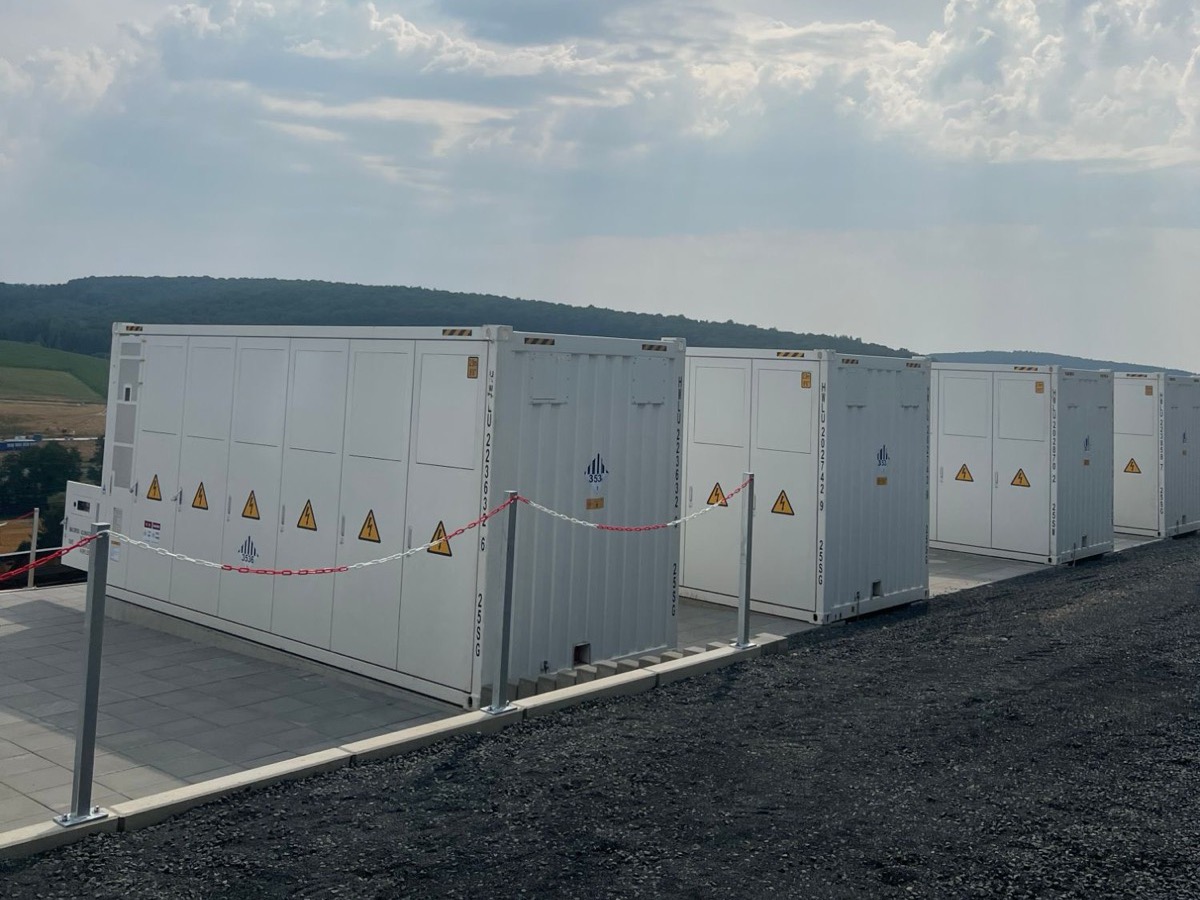
Design follows the task
Power and capacity are two quantities, and their ratio — the C-rate — determines which markets a plant can serve. High power with little capacity suits balancing services; four hours of discharge suits Arbitrage across the day.
That decision is made before ordering, not after. It rests on three things: available connection capacity, the expected development of spreads, and the marketing strategy.
We therefore model variants before fixing a rating — even where the connection point would in theory allow more.
Operating modes
In practice a plant combines several of these. The question is priority, not exclusivity.
| Mode | What the storage does | Typical design | Depends on |
|---|---|---|---|
| Arbitrage | charge at low prices, discharge at high prices on day-ahead and intraday | 2 to 4 hours of discharge | Spread, cycle count, forecast quality |
| Balancing services | holding and delivering frequency containment and restoration reserves | high C-rate, short discharge | prequalification, availability, market prices |
| Grid-supporting operation | absorbing generation that would otherwise be curtailed; relieving congestion | site-specific | grid situation, contractual arrangement |
| Voltage support | supplying or absorbing reactive power at the connection point | independent of capacity | requirements under VDE-AR-N 4110 |
| Grid-forming operation | setting voltage and frequency instead of following the grid | requires suitable inverters | operator requirement, certification |
Black start capability is technically possible but a special case with considerable extra effort in control and protection. We design it in only where a grid operator explicitly asks for it.
Market mechanics — how the price is formed
Every power plant sorted by marginal cost, demand as a vertical line above. Where the two meet stands the price — for everyone, including the cheap ones.
A simplified model, not a picture of the market. Plant fleet, availabilities and marginal costs change daily; imports, schedules, grid congestion and balancing reserve are not represented. What this chart shows is the mechanism — not tomorrow's price.
This chart needs JavaScript. Without it the text below stands complete: plants are called in order of marginal cost, and the most expensive one still needed sets the price for all.
Every plant has marginal costs: what one more megawatt-hour costs once the plant is running. For wind and solar that is zero — they have no fuel. For a thermal plant it is the fuel divided by the efficiency, plus the CO2 price for the emissions that come with it.
The exchange calls plants in that order, left to right, until demand is met. The last one still needed sets the price — for all of them. In that hour a wind farm receives the same price as the gas plant at the margin.
Push the wind and solar feed-in up. The staircase moves right, the expensive plants drop out of the market, the intersection slides down. That is the merit-order effect, and it is why a sunny midday is cheaper than a windless evening.
Market clearing price
—
- Price without storage
- —
- Price with storage
- —
- Difference
- —
All assumptions, in the open
- Where the capacities come from
- Net rated capacity of market power plants for 2025/2026, from the Federal Network Agency's determination of grid reserve demand.6
- Lignite 14,700 MW, hard coal 8,621 MW, natural gas 27,758 MW, oil products 1,650 MW
- Waste 1,876 MW, coke gas 2,012 MW and other 335 MW as one block: their fuel is a by-product or a disposal service, and they run regardless of price
- Wind and solar: around 68.1 GW onshore and 116.8 GW of photovoltaics installed at the end of 20257, plus 10.8 GW offshore by mid-20268 — the slider shows feed-in, not installed capacity
- Where the marginal costs come from
- Marginal cost = fuel divided by efficiency, plus CO2 price times emission factor divided by efficiency, plus variable operating costs. Fuel prices and the default CO2 price come from the same source as the capacities — they are the assumptions the Federal Network Agency itself uses to compute the dispatch order.6
- Natural gas €41.21/MWh of fuel heat, hard coal 14.04, lignite 3.00, oil 40.85
- Emission allowances €73.36/t
- Emission factors per MWh of fuel heat: lignite 0.399 t, hard coal 0.337 t, natural gas 0.201 t, heavy fuel oil 0.286 t9
- The efficiencies are assumptions
- They are the only part of the model without a source. Each fuel carries a range from the best to the worst unit, and the step runs linearly between them — in the German fleet a fuel is not one plant but a mix of vintages. Without that slope a 27.8 GW gas step would be a single flat line and nothing would move. The values sit in
content/meritorder.jsonrather than in the code, so they can be changed. - The order is not fixed
- It is sorted afresh at every slider position, and that is the heart of the matter. Lignite emits twice as much CO2 per MWh of fuel heat as natural gas. Pull the CO2 price up far enough and lignite moves to the right of gas. That is not a statement about fuels; it is a division.
- Why nuclear is not in the list
- Because it is no longer on the grid in Germany: the last three units went offline on 15 April 2023, and the source for these capacities consequently no longer lists them. In a merit order for France it would sit far to the left, right behind renewables — the fuel there costs around €1.4 per MWh of fuel heat, and it needs no emission allowances. That is not a statement about nuclear power but about where its marginal costs place it. The same holds for every other fuel on this axis.
- What happens below zero
- When wind and solar feed-in exceeds load there is no intersection left. The price that forms then is not a question of marginal costs but of what generators will pay to stay online. The model uses a straight line with a floor: €6 per megawatt-hour and gigawatt of surplus, capped at −150. That is an assumption, not a measurement — the direction is right, the number is picked.
- The storage layer
- 13.1 GW: 10,689 MW of pumped and reservoir hydro6 plus 2.4 GW of large-scale batteries as at October 2025.2 Below €25/MWh storage charges, above €95/MWh it discharges; in between it stands still. Both thresholds are picked and stand in for a day-ahead optimisation this chart cannot perform.
- Pumped storage therefore does not appear in the supply staircase — it would otherwise be counted twice.
- What storage does here is exactly what it does on the market: buy low, sell high. That it raises the low price and lowers the high one is not a side effect but the same movement seen from the other side.
- What is missing
- Imports and exports, outages and overhauls, heat obligations of CHP plants, start-up costs and minimum run times, grid congestion, balancing reserve, intraday trading and any expectation about the next day. Each of those shifts real prices, and none of them changes the mechanism this chart is about.
Co-location — using the connection point twice
In co-location storage and a generation plant share one connection point. That saves the most expensive and most protracted single item of a project: a new grid connection.
The second effect is operational. A solar plant generates more at midday than the connection lets through; storage absorbs the surplus and discharges it in the evening. Curtailed generation becomes sold generation.
The catch lies in the accounting split where the generation plant receives a feed-in tariff. That question is governed by the MiSpeL determination, due to enter into force on 1 October 2026.10 Until then — and through the transition after — every concept must hold under both regimes.
The grid connection package also provides for storage co-located with renewable plants to be connectable with priority.11 That turns a cost advantage into a time advantage.
One connection, two plants
Co-location with different generation types
Solar park, wind farm, biogas plant or power station: wherever a connection exists, storage can use it a second time.
| Generation | What the storage solves | Particularity |
|---|---|---|
| Solar | absorb the midday peak, discharge in the evening | The most common case. Generation profile and price profile run opposite — that is the entire business rationale. |
| Wind | smooth forecast error, steady the feed-in | Less regular than solar but present year-round. Needs greater capacity for the same effect. |
| Biogas and CHP | decouple plant operation from marketing | The plant can run heat-led while the storage handles market optimisation. |
| Decommissioned power station or connection without generation | use available connection capacity, for instance at a decommissioned site | Often simpler in planning terms because the land is already in use. |
From land to grid
The sequence follows the development stages; here is the technical view of it.
Grid pre-check
Estimate of available connection capacity at the nearest point and of the expected construction cost contribution.
Concept and design
Power, capacity, C-rate, layout, transformer concept, protection concept. The output is a single-line diagram.
Connection request
Submission with complete technical data. Completeness decides how long processing takes.
Permitting
Preliminary enquiry or building application, noise, fire safety and species protection reports, where relevant a check of the privilege under section 35 BauGB.
Certification route
Check unit certificates of components, prepare the plant certificate, involve the certifier before detailed design.
Construction and commissioning
Construction with established partners, declaration of conformity, commissioning at the connection point.
Common questions about grid-scale storage
Anyone who calls after reading this should be calling with a specific question, not a basic one.
How large does a site have to be for grid-scale storage?
Land is rarely the bottleneck. A 20 MW system fits on around half a hectare; projects are feasible from roughly 0.3 ha, and 0.5 to 2 ha is typical. What decides it is the distance to the grid connection point and the capacity available there — a large site without the grid is worthless, a small one at the right point is not. The suitability criteria in detail are on the page for landowners.
What does a grid connection cost, and what does that depend on?
Two items that are often confused. The connection itself — cable, transformer station, switchgear bay, wayleaves — rises with every metre of line. The construction cost contribution to the grid operator rises with connection capacity and the local capacity price; because that price is set per grid area, the same system can differ several-fold between two sites. A ballpark figure on a website would therefore mislead: the number comes out of the grid pre-check, and for us that stands at the beginning, not the end.
What is a construction cost contribution and who pays it?
A one-off contribution by the connecting party to the costs of the upstream grid; above low voltage the grid operator calculates it under the capacity price model. The operator of the storage system pays it. That this also applies to battery storage was confirmed by the Federal Court of Justice on 15 July 2025 — even though storage does not consume the electricity it takes, but feeds it back later.12 Because it steers site selection, we estimate it before securing land rather than after; the details are in Regulation.
How long does a grid connection process realistically take?
From a complete request to an offer we reckon with 3 to 18 months, and from the offer to readiness to build with another 6 to 18. The range is not evasion — it depends on the grid operator, the voltage level and whether a grid compatibility study or network reinforcement is needed. What can be influenced is the completeness of the request: missing documents cost more time than any technical query. Under the grid connection package, from 2027 it is meant to be demonstrable maturity that counts rather than order of arrival.11
What does VDE-AR-N 4110 mean for my project in practice?
The application rule covers every customer installation on the 1 to 60 kV medium-voltage grid, storage included, and sets out a three-step chain of evidence: unit certificates for the components, a plant certificate for the design, a declaration of conformity after construction. Without a plant certificate there is no commissioning.13 The practical point is timing: requirements for reactive power, protection settings and grid behaviour drive the design — whoever brings in the certifier only after detailed engineering plans twice.
What is the difference between grid-serving and market-driven operation?
Market-driven means the system follows price: charging when electricity is cheap, discharging when it is expensive. Grid-serving means it follows the situation in the network, absorbing generation that would otherwise be curtailed and relieving congestion. In practice this is not either/or but a priority in the schedule and a question of the contract with the grid operator. It still has to be settled, and settled in advance — otherwise chance decides when the two conflict.
What is co-location and when does it pay?
Storage and generation share one grid connection point. That removes the most expensive and slowest single item of a project, the new connection. It almost always pays where a connection exists and is not fully used — with photovoltaics in particular, because generation and price profiles run in opposite directions. The catch lies in the metering separation while the existing plant still receives a feed-in tariff; that is governed by the MiSpeL determination, scheduled to enter into force on 1 October 2026.10
Does battery storage need a building permit?
As a rule, yes. In the outer area the privilege under section 35 BauGB has, since December 2025, been able to spare a development plan procedure: in spatial and functional connection with an existing renewable installation, or from 4 MW within 200 metres of a substation.14 That does not replace the building permit itself — noise, fire safety and species protection reports are part of it. And the privilege is capped per municipality, which makes it a scarce good: whoever applies first uses up an allowance the next applicant will lack.
How long does a battery storage system last?
Design life is taken as 15 to 20 operating years, while leases usually run 20 to 25 — the difference is deliberate and covers replacement and decommissioning. Cells age by two mechanisms at once: by cycle and by time. Manufacturers therefore guarantee a residual capacity at a given date, but only under conditions written into the contract: temperature window, C-rate, cycles per year. Leaving those conditions in operation does not cost you the plant, but it costs you the basis of its calculation.
What happens to the plant at the end of its term?
Two things that belong apart. Decommissioning is part of the contract and backed by security, so that it does not fall to the landowner; the site is returned in the condition in which it was taken. What happens to the cells — second life in less demanding applications, or material recovery — will be decided by a market that does not yet exist at this scale. That is the honest state of it, and we say no more than that.
Does storage suit my wind farm?
If the connection allows, yes. At a wind farm, storage smooths forecast errors and steadies the feed-in. Because wind blows less regularly than the sun shines, it needs more capacity for the same effect than at a solar park.
Does storage pay off at a biogas plant?
It decouples the operating mode from marketing: the plant can run heat-led while the storage takes over optimisation on the power market. Whether it pays depends on connection, remuneration and heat concept — we calculate it for your plant.
What becomes of the connection of a decommissioned power station?
It remains a grid connection point with capacity — and that is scarce. Storage can keep using it; in planning terms this is often simpler because the land is already in use.
Sources
Sources last reconciled on
- Bundesnetzagentur | SMARD.de: Day-ahead wholesale prices, bidding zone DE-LU, hourly and quarter-hour resolution (licence CC BY 4.0). As of 2026-09-12. Go to source
- Bundesnetzagentur: Electricity storage – large-scale battery stock (market master data register, as of 15 Oct 2025). As of 2025-10-15. Go to source
- Modo Energy: Germany BESS buildout report – capacity growth 2025. As of 2026-02-04. Go to source
- pv magazine Deutschland (Auswertung Marktstammdatenregister): Fewer new battery systems installed in 2025, but with more capacity. As of 2026-01-06. Go to source
- EPEX SPOT: 15-minute products live on EPEX SPOT Day-Ahead markets. As of 2025-10-01. Go to source
- Bundesnetzagentur: Determination of grid reserve demand for winter 2025/2026 and the period April 2027 to March 2028, table 1 (net rated capacity of market power plants) and table 2 (fuel and CO2 prices). As of 2025-04-28. Go to source
- Fraunhofer ISE: Press release: German public electricity generation in 2025 — wind and solar take the lead (installed capacity figures). As of 2026-01-01. Go to source
- Stiftung OFFSHORE-WINDENERGIE: Status of offshore wind expansion in Germany, first half of 2026. As of 2026-07-15. Go to source
- Landesamt für Umwelt Brandenburg, nach Umweltbundesamt (2022): CO2 emission factors by energy carrier (LfU-T14). As of 2025-02-28. Go to source
- Bundesnetzagentur: Determination procedure on market integration of storage and charging points (MiSpeL), ref. 618-25-02. As of 2026-08-05. Go to source
- Bundesregierung: Cabinet adopts EEG amendment and grid connection package. As of 2026-07-29. Go to source
- Bundesgerichtshof: Press release: Federal Court of Justice approves construction cost contribution for battery storage (decision of 15 July 2025, EnVR 1/24). As of 2025-07-15. Go to source
- VDE FNN: Technical connection rule medium voltage VDE-AR-N 4110:2023-09 (draft revision E VDE-AR-N 4110:2024-11). As of 2023-09. Go to source
- Rödl & Partner (Erläuterung des Geothermiebeschleunigungsgesetzes): Battery storage in the outer area – privilege under section 35(1) nos. 11 and 12 BauGB. As of 2025-12-11. Go to source