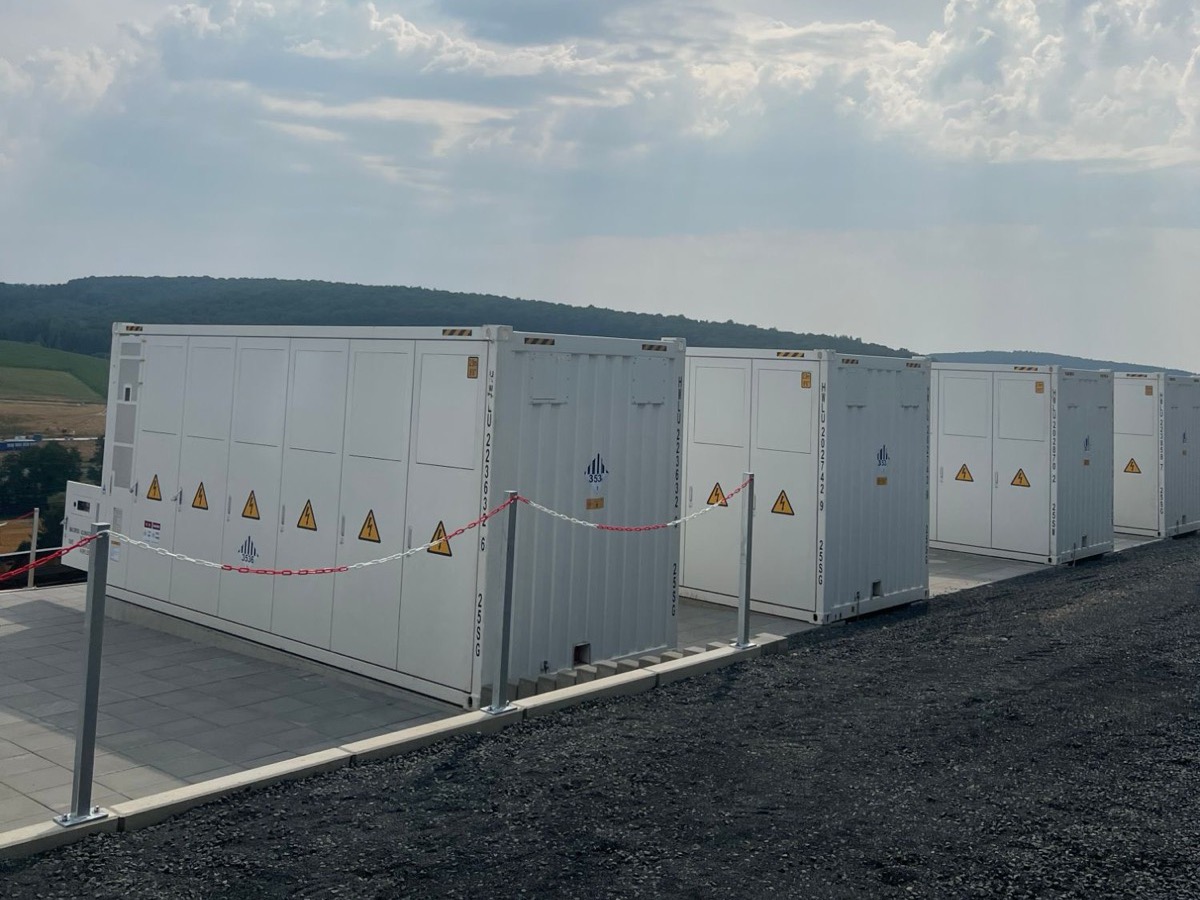
Why the load profile decides everything
German industrial grid fees consist of an energy charge for consumption and a capacity charge for the highest quarter-hour demand in the billing period. The capacity charge is therefore set by a handful of quarter-hours per year.
Storage that catches exactly those peaks lowers the capacity charge permanently — without changing anything in production. That is peak shaving.
How much that is worth cannot be estimated. It follows from your load profile: how high the peaks are, how often they occur, how long they last, and how much time lies between them. Two sites with identical annual consumption can need entirely different storage.
Where the money sits in your load profile
Drag the cap through the load profile. Everything above it is taken by the storage unit — and the figures show immediately how large it has to be.
The load profile shown is synthetic — it behaves like a real one, but it is not one. With your own load profile the result looks different, and that is exactly what we should talk about.
The chart needs JavaScript. The line shows the daily maxima of the year; the assumptions below apply unchanged.
Dragging sets the cap. A click in the chart goes one level deeper.
Rounded means from three published 2026 price sheets, each for 2,500 utilisation hours a year or more. Note the pattern: the deeper in the network, the higher the demand charge per kilowatt — small operations pay more, not less.
Or calculate backwards
- Cap
- —
- Demand charge saved per year
- —
- Usable capacity required
- —
- Storage power required
- —
- Capping events per year
- —
- Discharge duration at the sizing event
- —
Every assumption, in the open
- The load profile is synthetic
- Generated with
tools/lastgang.py, not a customer profile and not a measurement: a metal-processing plant running three shifts Monday to Friday, an early shift on Saturday, plant holidays in August and between Christmas and New Year.- 35,040 quarter-hour values across a full year
- annual peak 3,568 kW in the sample plant, base load 512 kW
- 15,033 MWh a year, 4,213 full-load hours
- The level is scaled, the shape is not
- Enter a different annual peak and the same profile is scaled linearly onto it: base load, peaks and energy all grow in the same ratio. What moves with it and what does not is the actual point:
- Scales with it: saving, capacity and power, all three linearly.
- Stays the same: the number and timing of events, the discharge duration and the ratio of largest to average event.
- That is why the shape of your load profile decides, not its level. Two plants with the same annual peak can need entirely different storage.
- Capacity from the largest event
- The required capacity comes from the energetically largest capping event of the year, not from the average. A unit sized for the average event is empty at the largest one — and then the peak appears on the invoice after all. A single missed event costs the whole year's result.
- Usable is not installed
- What is stated is the usable capacity at the sizing event. Installed capacity is higher: depth of discharge, ageing reserve and efficiency are added. How much higher depends on the cell technology and the manufacturer's warranty.
- Recharging is not modelled
- Between two events the unit has to refill, and it has to do so when load is low. Charging at the wrong time creates a new peak of its own. This profile leaves ample time; in a plant with closely spaced peaks it is the actual design question.
- Below the base load there is no capping
- The cap cannot be dragged below the base load of 512 kW. Below it there would be no event but continuous operation — the calculation would produce a unit the size of the annual consumption, and that is no longer peak shaving.
- The billed peak
- The demand charge is based on the highest quarter-hour average of the billing year. This calculation assumes the unit caps every event completely — if it misses one, the old peak applies again.
- The demand charge, in figures
- There is no official national average: the demand charge is set by each network operator for each voltage level. Three verified price sheets for 2026, each for 2,500 utilisation hours a year or more:
- Netze BW: medium voltage €148.05/kW/a, low voltage €171.87/kW/a1
- SWM Infrastruktur, Munich: medium voltage €132.13/kW/a, low voltage €153.13/kW/a2
- Mittelhessen Netz: medium voltage €105.77/kW/a, low voltage €114.02/kW/a3
- The gap between two network operators is therefore wider than the gap between two voltage levels. The figure on your invoice beats every preset.
- Below 2,500 utilisation hours the arithmetic flips
- The annual demand charge system has two regimes. From 2,500 utilisation hours a year the demand charge carries the grid fee; below that, the energy price does: in the same price sheets the demand charge then drops to €14 to 35/kW/a. A plant that draws high power for few hours a year saves almost nothing on grid fees by shaving peaks. This profile sits firmly in the upper regime at 4,213 full-load hours — yours may not.
- Not included
- What is calculated is the demand charge, nothing else. Not included:
- the energy price and the rest of the grid fee systematics
- atypical network use and individual grid fees under § 19 (2) StromNEV
- levies, taxes, connection cost contributions
- revenue on the power market — a unit that shaves peaks can trade alongside
- No return figure
- This calculator states a saving, not a return and not a payback period. Both require capital expenditure, financing and operating costs; it does not know them. And it is not a design: a defensible sizing needs your measured load profile, your grid fees and the way your plant runs.
Four applications, usually in parallel
| Application | Effect | Value depends on |
|---|---|---|
| Peak shaving | lowers the capacity charge in the grid fee | height and frequency of peaks, capacity charge in the grid area |
| Self-consumption optimisation | stores surplus from on-site solar or CHP for later use | size of on-site generation, time gap between generation and demand |
| Security of supply | bridges grid disturbances for critical processes | cost of a production outage, required bridging time |
| Market participation | markets unused capacity on energy markets | free capacity after own needs, marketing contract |
The fourth application is an addition, not a foundation. If storage only pays through market participation, it is usually in the wrong place at an industrial site.
How we proceed
Load profile analysis
Evaluation of quarter-hour values over twelve months: peaks, duration, frequency, seasonal patterns. The output answers whether storage achieves anything at all.
Sizing
Power and capacity chosen so that peaks are reliably shaved — no larger. Oversized storage costs money without saving more.
Economics
Investment, operating cost and savings over the lifetime, with sensitivities for grid fees, power prices and load development. Including where the result argues against investing.
Engineering
Connection to the existing installation, protection concept, layout, fire safety. Where connected at medium voltage, under VDE-AR-N 4110.
Delivery
Construction and commissioning through our partner network, with one interface for you.
On the funding landscape
Funding for storage and charging infrastructure in Germany is regionally fragmented and changes frequently. Federal grant programmes for charge points that were previously available no longer accept applications in some cases.
We therefore check case by case which state and municipal programmes are actually open at the time of your enquiry — rather than keeping a list here that will be wrong in three months.
Common questions about industrial storage
The basics are here so that a conversation has time for your load profile.
What makes up the capacity charge?
Industrial grid fees have two parts: an energy charge per kilowatt-hour for consumption and a capacity charge per kilowatt and year for the highest quarter-hourly load of the billing year. Every grid operator sets the capacity charge itself, per voltage level; there is no official national average. Three verified 2026 price sheets show the spread at medium voltage: €148.05/kW/a at Netze BW1, €132.13/kW/a at SWM Infrastruktur2, €105.77/kW/a at Mittelhessen Netz.3 The gap between two grid operators is thus larger than the gap between two voltage levels.
How is the annual peak load measured, and over what period?
What is measured is the average active power over each quarter-hour; what is billed is the highest of those values in the billing year. A single quarter-hour therefore sets the cost of twelve months. That is why a system that shaves 51 of 52 events is not 98 per cent successful but has failed — miss one event and the old peak applies again. Whether the billing period is the calendar year is set out in your network use contract.
From what peak load does peak shaving pay?
It is not decided by the height of the peak but by its shape: how far above base load it sits, how often it occurs, how long it lasts and how much time is left in between to recharge. One condition is hard — below 2,500 utilisation hours a year the energy charge carries the grid fee rather than the capacity charge, which in the same price sheets falls to €14–35/kW/a123, and peak shaving then saves almost nothing. Whoever draws high power for few hours a year is the wrong case. The tool above shows the order of magnitude on a synthetic load profile; it becomes meaningful with your own.
How large does the storage system have to be for my peaks?
As large as the year's largest shaving event in energy terms, not the average one. A system sized for the mean is empty at the largest event — and then the peak appears in the bill after all. The ratio of largest to average event is therefore the real design parameter, and it depends on the shape of your load profile, not its height. To that add the difference between usable and installed: depth of discharge, ageing reserve and efficiency all load onto installed capacity.
What is atypical grid use and when does it apply?
A rule under section 19(2) StromNEV: anyone who predictably keeps their peak load outside the grid operator's high-load windows can agree a reduced grid fee. It is worth considering for sites whose peaks already fall there or can be moved there — and storage can produce that deliberately. The catch: this mode competes with peak shaving for the same capacity. Which of the two is worth more is a calculation, not a matter of principle, and it comes out differently at every site.
Can I also trade the storage on the market?
Yes, and usually it makes sense — but as an addition, not a foundation. Capacity left after own requirements can be placed on the energy markets through an aggregator. Two limits: peak shaving takes priority, because one missed event costs more than a trading day earns, and trading raises the cycle count and with it ageing. If a system only adds up through market participation, it is usually in the wrong place at an industrial site.
What happens during a power cut?
A standard system follows the grid and shuts down in an outage — it is not an uninterruptible power supply. Grid forming inverters can keep a defined part of the site supplied in island mode; that requires transfer equipment, a protection concept and agreement with the grid operator, and it costs. Whether it pays depends on a number you know and we do not: what an hour of lost production costs. That number belongs at the start of the conversation, not the end.
Do I need a permit for storage on my own site?
Usually yes, but more simply than on a greenfield. In commercial or industrial zones storage is as a rule admissible as an ancillary installation; a building application or notification is still needed depending on the state building code, along with a fire safety concept and coordination with the fire service. Connection at medium voltage adds the chain of evidence under VDE-AR-N 4110. Exactly what applies depends on the state building code and the development plan for your site — we settle that before the design, not after.
How long do planning and construction take?
For load analysis and the business case, reckon in weeks rather than months — provided twelve months of quarter-hourly values are available. From decision to commissioning it is usually 9 to 18 months. The longest single item is rarely construction, but coordination with the grid operator and component lead times. If you have a date by which the system must be running, name it first: it co-determines which technology is even in question.
What changes about my grid connection?
Technically the system sits behind your existing connection, on the low- or medium-voltage side of your transfer station depending on size. Contractually you have to notify the grid operator; from medium voltage the chain of evidence under VDE-AR-N 4110 with a plant certificate applies. Your contracted capacity stays as it is for now — lowering it is a separate negotiation that only makes sense once the new peak has been demonstrated. What changes immediately is what a single quarter-hour is worth in your bill.
Sources
Sources last reconciled on
- Netze BW GmbH: Final prices for use of the electricity distribution network, valid from 1 January 2026 (price sheet 1, annual demand charge system). As of 2026-01-01. Go to source
- SWM Infrastruktur GmbH & Co. KG: Electricity network charges 2026 — network use, annual demand charge system. As of 2026-01-01. Go to source
- Mittelhessen Netz GmbH: Price sheet for use of the electricity network from 1 January 2026, customers with quarter-hour demand metering. As of 2026-01-01. Go to source